
As a result, we’ve seen further hikes in government bond yields, with UK gilts rising to their highest level since the financial crisis in 2008 or in some cases even longer. 30-year gilts hit 5.89 per cent earlier this week, their highest since 1998, with 10-year gilts at 5.25 per cent.
This won’t be a welcome return to work for Andy Burnham or his new Chancellor, with estimates suggesting higher bond yields could wipe more than £10bn from John Healey’s fiscal headroom in advance of the next Budget on 28 October. And with the Office for Budget Responsibility running its usual calculations in the run-up, even if conditions improve it’s likely that these will feed into their forecast. Meaning the government will be expected to spend more servicing debt.
There are likely some new leadership wobbles impacting here too, but this is far from a UK specific issue. Indeed, the UK economy has been more resilient than many had expected earlier in the year. Back in January the consensus forecast for UK GDP was for growth of 1 per cent in 2026. Following heightened geopolitical uncertainty this dropped back to 0.6 per cent in the Spring, but expectations have returned to January’s 1 per cent figure in the latest August consensus numbers. Inflation expectations remain higher than they were back in January, but despite recent increases inflation is expected to top out below some of the higher forecasts we’ve seen in recent months.
House prices
Mortgage approvals dropped back in July, with 15 per cent fewer approvals for house purchase than in the same month a year earlier. An assortment of housing stats released over the summer have pointed to what remains a broadly flat market.
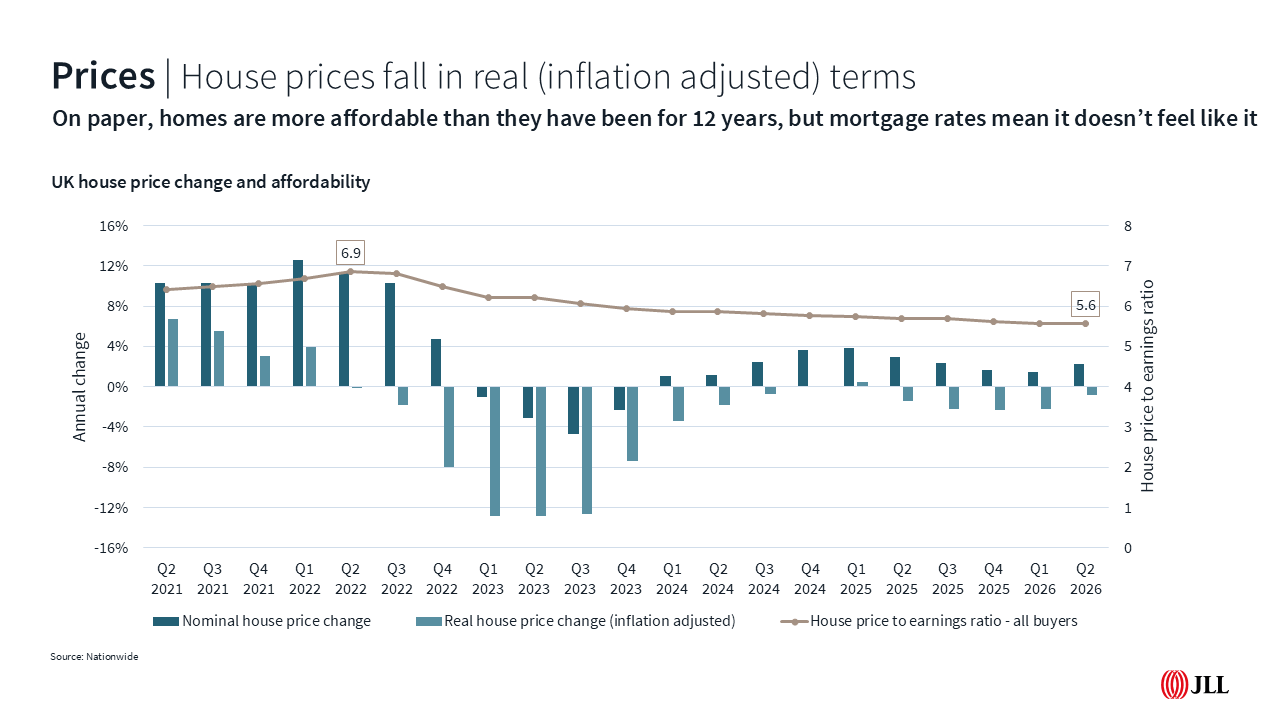
The Nationwide House Price Index, the first to report August figures, shows prices were 1.6 per cent higher than they were a year ago. This is a slightly rosier picture than that portrayed by the Lloyds Index (formerly the Halifax House Price Index) which puts prices just 0.1 per cent higher than July 2025 (we’ll need to wait until Monday for their August number). Most markets have seen marginal price increases, but price growth has remained broadly below inflation. This means that affordability continues to improve, at least when viewed on a house price-to-income ratio basis. Nationwide figures show inflation adjusted house prices are 18 per cent lower than they were in Q1 2022 (non-inflation adjusted they are 7 per cent higher) with the house price to household income ratio nationally at its lowest since 2014 at 5.6X income. But higher mortgage rates continue to erode the benefits of the increase in spending power.
Mortgage markets
Higher bond yields and sticky inflation have impacted swap rates, meaning average fixed rates have crept up in recent months, all at a time when we’d been hoping for some respite. Those shopping for a two-year fix are currently paying an average of 5.5 per cent according to Moneyfacts, with best-buy rates circa 4.5. This means that homeowners are having to pay more each month to borrow the same amount or if they keep their outgoings the same are forced to borrow less.
If we take an average priced London home, currently £554,000 according to the Land Registry, those purchasing at 75 per cent loan to value over 25-years would be paying just over £2,550 per month for a repayment mortgage at 5.5 per cent. This is almost £3,000 a year more than those who managed to secure a 4.5 per cent fix, and almost £6,000 a year higher than if rates were at 3.5 per cent—the level best-buys hit back in early February.
Or to keep repayments at the £2,000 a month paid at 3.5 per cent buyers paying 4.5 per cent would be borrowing £40,000 less and at 5.5 per cent their borrowing power would be reduced by £76,000.
Rental Market
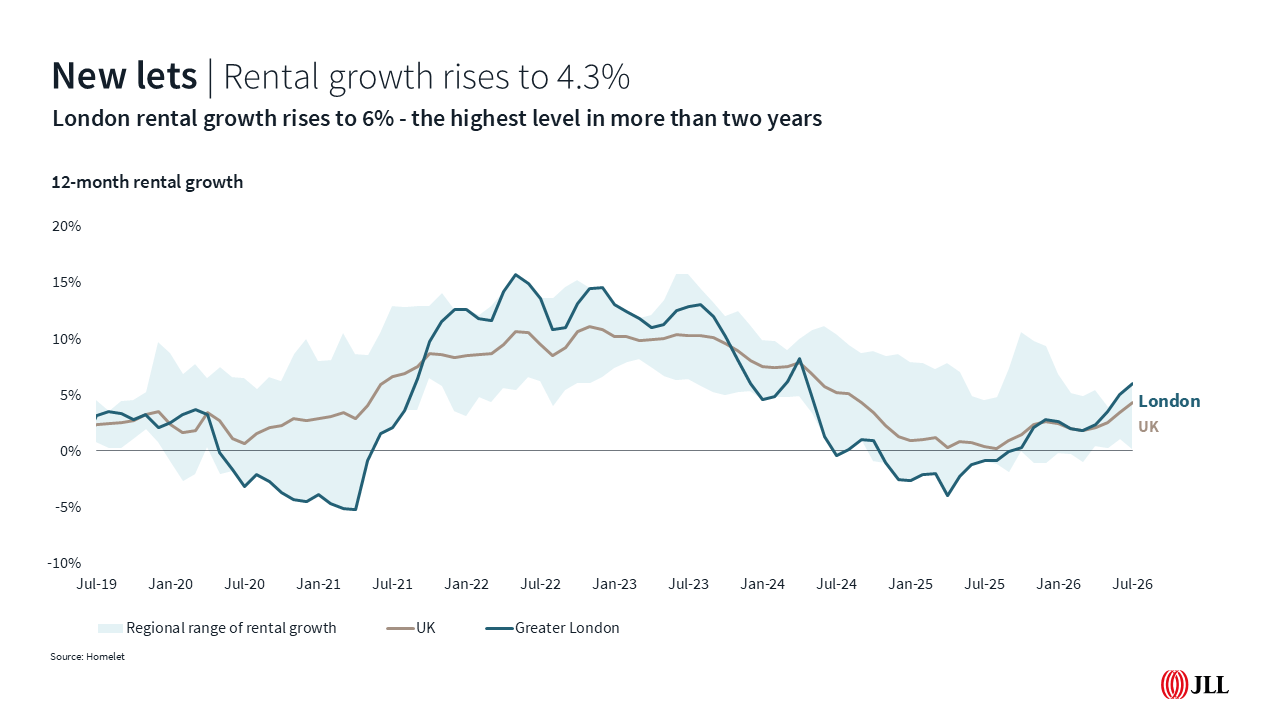
A cautious sales market continues to benefit lettings. July figures from HomeLet show rents rose 4.3 per cent nationally in the last 12 months, with rents in London rising 6 per cent over the same period.
Respondents to the latest RICS survey reported an increase in new tenant enquiries for the seventh consecutive month. Meanwhile, landlord instructions remained down, with a net balance of -22 per cent reporting a fall—the last time more respondents reported an increase was back in March 2022.
Checking our homework
With English schools heading back this week it's a good opportunity to check our view on 2026. We reforecast house prices and rents back in May, downgrading our short-term outlook for prices and increasing our rental expectations for 2026.
Using the latest government figures shows average prices are currently 1.2 per cent higher nationally in June than they were in December. We’re forecasting the year to end broadly flat (down 0.5 per cent), which would mean a fall in prices of 1.7 per cent in H2. In London we’re expecting prices to fall 2.5 per cent this year. Current annual falls sit at that level, but prices have risen marginally since December, meaning to end the year at 2.5 per cent down we’d need a 3.3 per cent reduction in prices in H2.
Average rents (for both new lets and existing tenancies from the ONS Private Rents Index) are up 1.9 per cent since December and 3.7 per cent annually. We're forecasting 3.5 per cent for 2026, meaning we'll need a further 1.6 per cent (or £22) increase to rents to hit our December forecast. In London we're forecasting 3 per cent this year, rents rose 2.2 per cent to December to July (up 3 per cent annually) meaning just a further 0.8 per cent needed between now and December. Not far off for the UK but a bit light for London? We'll need to wait and see.
JLL’s Residential and Living team consists of over 300 professionals who provide a comprehensive end-to-end service across all residential property types, including social housing, private residential, build to rent, co-living, later living, healthcare and student housing.
Disclaimer: © 2026 Jones Lang LaSalle IP, Inc. All rights reserved. Data within this report is based on material/sources that are deemed to be reliable and has not been independently verified by JLL. JLL makes no representations or warranties as to the accuracy, completeness or suitability of the whole or any part of the report which has been produced solely as a general guide and does not constitute advice. No part of this publication may be reproduced or transmitted in any form or by any means without prior written consent of JLL. JLL, its officers, employees shall not be liable for any loss, liability, damage or expense arising directly or indirectly from any use or disclosure of or reliance on such report. JLL reserves the right to pursue criminal and civil action for any unauthorized use, distribution or breach of such intellectual property